How Analyzing Zomato Restaurant Data Can Help You Extract the Best Cuisines Data in Local Areas?

Zomato restaurant data scraping is among the most valuable tools for foodies looking to sample the finest cuisines from across the world while staying within their budget. This research is also helpful for people looking for low-cost eateries in various parts of the nation that serve a variety of cuisines. Additionally, restaurant data extraction responds to the demands of consumers who are looking for the best cuisine in a country and which locality in that country has the most restaurants serving that cuisine.
Dataset Details
Restaurant Id: Every restaurant’s unique identifier in numerous cities throughout the world
Restaurant Name: Name of the restaurant
Country Code: Location of the Country in which Restaurant is located
Address: Address of the restaurant
Locality: City location
Locality Verbose: Detailed explanation of the location — Longitude: The location of the restaurant’s longitude coordinates
Latitude: The restaurant’s location’s latitude coordinate
Cuisines: The restaurant’s menu includes a variety of cuisines.
Average cost for two: Cost of two individuals in different currencies
Currency: Currency of the country
Has Table Booking: yes/no
Has Online Delivery: Yes/No
Is Delivering: Yes/ No
Switch to order menu: Yes/No
Price range: range of price of food
Aggregate Rating: Average rating out of 5
Rating color: Depending upon the average rating color
Rating text: text depending on basis of rating
Votes: Number of ratings casted by people.
Dataset Importing
This project can be developed on google Colab. The dataset can be downloaded as follows:
from google.colab import files files.upload() ! pip install opendatasets --upgrade import opendatasets as od dataset_url = 'https://www.kaggle.com/shrutimehta/zomato-restaurants-data' od.download(dataset_url)Reading Data Using Pandas
import pandas as pd df = pd.read_csv('/content/zomato-restaurants-data/zomato.csv', engine='python') df.head(2)Restaurant IDRestaurant NameCountry CodeCityAddressLocalityLocality VerboseLongitudeLatitudeCuisinesAverage Cost for twoCurrencyHas Table bookingHas Online deliveryIs delivering nowSwitch to order menuPrice rangeAggregate ratingRating colorRating textVotes
Checking if Dataset Contains any Null
## Checking if dataset contains any null nan_values = df.isna() nan_columns = nan_values.any() columns_with_nan = df.columns[nan_columns].tolist() print(columns_with_nan) ['Cuisines']Null values appear to exist in cuisines. As a result, any additional study employing Cuisines must take the NaN values into account.
Along with this dataset, there is another file that is also available.
df1 = pd.read_excel('/content/zomato-restaurants-data/Country-Code.xlsx') df1.head()Let’s combine the two datasets. This will assist us in comprehending the dataset on a country-by-country basis.
Restaurant IDRestaurant NameCountry CodeCityAddressLocalityLocality VerboseLongitudeLatitudeCuisinesAverage Cost for twoCurrencyHas Table bookingHas Online deliveryIs delivering nowSwitch to order menuPrice rangeAggregate ratingRating colorRating textVotesCountry
df2 = pd.merge(df,df1,on='Country Code',how='left') df2.head(2)Exploratory Zomato Restaurant Analysis and Visualizations
Before we ask questions about the dataset, it’s important to understand the geographical spread of the restaurants, as well as the ratings, currency, online delivery, city coverage, and so on.
List of Countries the Survey is Done
print('List of counteris the survey is spread accross - ') for x in pd.unique(df2.Country): print(x) print() print('Total number to country', len(pd.unique(df2.Country)))List of countries the survey is spread across -
Total number to country 15
The study appears to have been conducted in 15 nations. This demonstrates that Zomato is an international corporation with operations in all of those nations.
from plotly.offline import init_notebook_mode, plot, iplot labels = list(df2.Country.value_counts().index) values = list(df2.Country.value_counts().values) fig = { "data":[ { "labels" : labels, "values" : values, "hoverinfo" : 'label+percent', "domain": {"x": [0, .9]}, "hole" : 0.6, "type" : "pie", "rotation":120, }, ], "layout": { "title" : "Zomato's Presence around the World", "annotations": [ { "font": {"size":20}, "showarrow": True, "text": "Countries", "x":0.2, "y":0.9, }, ] } } iplot(fig)
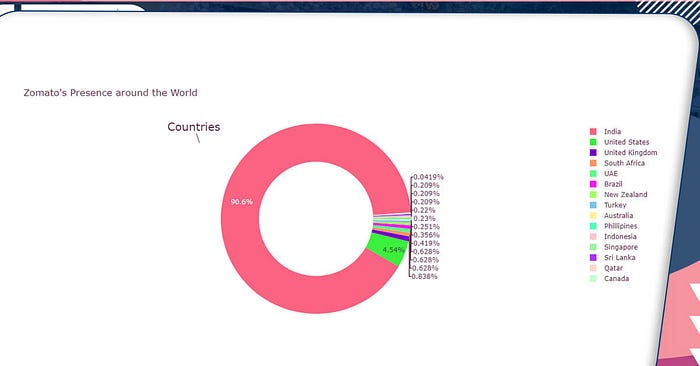
Zomato is an Indian startup, thus it’s only natural that it has the most business among Indian restaurants.
Understanding the Rating aggregate, Color, and Text
df3 = df2.groupby(['Aggregate rating','Rating color', 'Rating text']).size().reset_index().rename(columns={0:'Rating Count'}) df3 df3Restaurant IDRestaurant NameCountry CodeCityAddressLocalityLocality VerboseLongitudeLatitudeCuisinesAverage Cost for twoCurrencyHas Table bookingHas Online deliveryIs delivering nowSwitch to order menuPrice rangeAggregate ratingRating colorRating textVotesCountry
The preceding information clarifies the relationship between aggregate rating, color, and text. Finally, we assign the following hue to the ratings:
Rating 0 — White — Not rated
Rating 1.8 to 2.4 — Red — Poor
Rating 2.5 to 3.4 — Orange — Average
Rating 3.5 to 3.9 — Yellow — Good
Rating 4.0 to 4.4 — Green — Very Good
Rating 4.5 to 4.9 — Dark Green — Excellent
Let’s try to figure out why eateries have such a wide range of ratings.
import seaborn as sns import matplotlib import matplotlib.pyplot as plt %matplotlib inline sns.set_style('darkgrid') matplotlib.rcParams['font.size'] = 14 matplotlib.rcParams['figure.figsize'] = (9, 5) matplotlib.rcParams['figure.facecolor'] = '#00000000' plt.figure(figsize=(12,6)) # plt.xticks(rotation=75) plt.title('Rating Color') sns.barplot(x=df3['Rating color'], y=df3['Rating Count']);
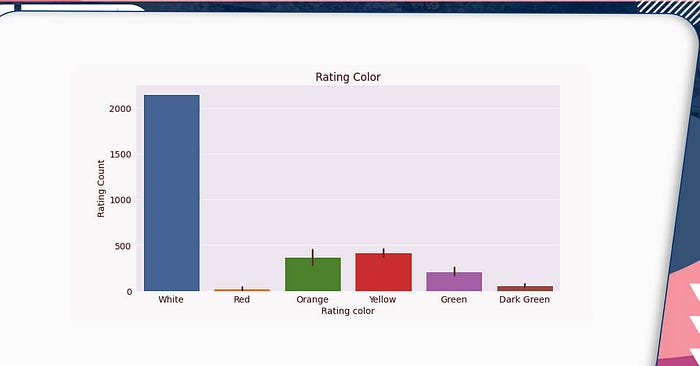
Surprisingly, the majority of establishments appear to have dropped their star ratings. Let’s see whether any of these restaurants are from a specific country.
No_rating = df2[df2['Rating color']=='White'].groupby('Country').size().reset_index().rename(columns={0:'Rating Count'}) No_ratingIndia appears to have the highest number of unrated restaurants. Because the habit of ordering food is still gaining traction in India, most eateries remain unrated on Zomato, as individuals may choose to visit the restaurant for a meal.
Country and Currency
country_currency = df2[['Country','Currency']].groupby(['Country','Currency']).size().reset_index(name='count').drop('count', axis=1, inplace=False) country_currency.sort_values('Currency').reset_index(drop=True)The table above shows the countries and the currencies they accept. Surprisingly, four countries appear to accept dollars as a form of payment.
Online Delivery Distribution
plt.figure(figsize=(12,6)) plt.title('Online Delivery Distribution') plt.pie(df2['Has Online delivery'].value_counts()/9551*100, labels=df2['Has Online delivery'].value_counts().index, autopct='%1.1f%%', startangle=180);
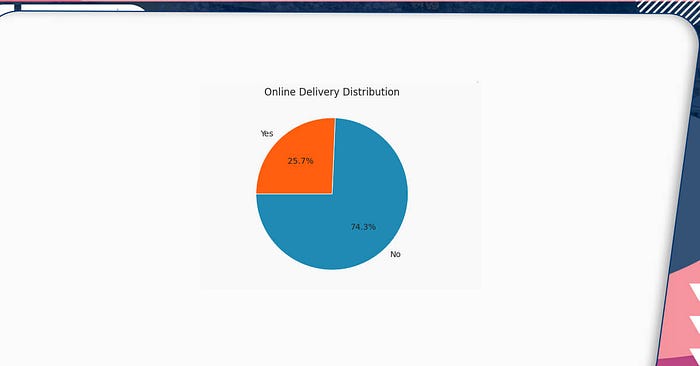
Only around a quarter of eateries accept internet orders. Because the majority of the restaurants listed here are from India, this data may be skewed. Perhaps a city-by-city examination would be more useful.
Understanding the Coverage of the City
from plotly.offline import init_notebook_mode, plot, iplot import plotly.graph_objs as go plt.figure(figsize=(12,6)) # import plotly.plotly as py labels = list(df2.City.value_counts().head(20).index) values = list(df2.City.value_counts().head(20).values) fig = { "data":[ { "labels" : labels, "values" : values, "hoverinfo" : 'label+percent', "domain": {"x": [0, .9]}, "hole" : 0.6, "type" : "pie", "rotation":120, }, ], "layout": { "title" : "Zomato's Presence Citywise", "annotations": [ { "font": {"size":20}, "showarrow": True, "text": "Cities", "x":0.2, "y":0.9, }, ] } } iplot(fig);

Questions and Answers
Which locality has maximum hotels listed in Zomato?
Delhi = df2[(df2.City == 'New Delhi')] plt.figure(figsize=(12,6)) sns.barplot(x=Delhi.Locality.value_counts().head(10), y=Delhi.Locality.value_counts().head(10).index) plt.ylabel(None); plt.xlabel('Number of Resturants') plt.title('Resturants Listing on Zomato');

Connaught Place appears to have a large number of restaurants listed on Zomato. Let’s take a look at the cuisines that the highest eateries have to offer.
2. What Kind of the Cuisines Highly Rated Restaurants Offers?
# I achieve this by the following steps ## Fetching the resturants having 'Excellent' and 'Very Good' rating ConnaughtPlace = Delhi[(Delhi.Locality.isin(['Connaught Place'])) & (Delhi['Rating text'].isin(['Excellent','Very Good']))] ConnaughtPlace = ConnaughtPlace.Cuisines.value_counts().reset_index() ## Extracing all the cuisens in a single list cuisien = [] for x in ConnaughtPlace['index']: cuisien.append(x) # cuisien = '[%s]'%', '.join(map(str, cuisien)) cuisien ['North Indian, Chinese, Italian, Continental', 'North Indian', 'North Indian, Italian, Asian, American', 'Continental, North Indian, Chinese, Mediterranean', 'Chinese', 'Continental, American, Asian, North Indian', 'North Indian, Continental', 'Continental, Mediterranean, Italian, North Indian', 'North Indian, European, Asian, Mediterranean', 'Japanese', 'Bakery, Desserts, Fast Food', 'North Indian, Afghani, Mughlai', 'Biryani, North Indian, Hyderabadi', 'Ice Cream', 'Continental, Mexican, Burger, American, Pizza, Tex-Mex', 'North Indian, Chinese', 'North Indian, Mediterranean, Asian, Fast Food', 'North Indian, European', 'Healthy Food, Continental, Italian', 'Continental, North Indian, Italian, Asian', 'Continental, Italian, Asian, Indian', 'Biryani, Hyderabadi', 'Bakery, Fast Food, Desserts', 'Italian, Mexican, Continental, North Indian, Finger Food', 'Cafe', 'Asian, North Indian', 'South Indian', 'Modern Indian', 'North Indian, Chinese, Continental, Italian', 'North Indian, Chinese, Italian, American, Middle Eastern', 'Fast Food, American, Burger'] from wordcloud import WordCloud, STOPWORDS import matplotlib.pyplot as plt import pandas as pd comment_words = '' stopwords = set(STOPWORDS) # iterate through the csv file for val in cuisien: # typecaste each val to string val = str(val) # split the value tokens = val.split() # Converts each token into lowercase for i in range(len(tokens)): tokens[i] = tokens[i].lower() comment_words += " ".join(tokens)+" " wordcloud = WordCloud(width = 800, height = 800, background_color ='white', stopwords = stopwords, min_font_size = 10).generate(comment_words) # plot the WordCloud image plt.figure(figsize = (8, 8), facecolor = 'b', edgecolor='g') plt.title('Resturants cuisien - Top Resturants') plt.imshow(wordcloud) plt.axis("off") plt.tight_layout(pad = 0) plt.show()
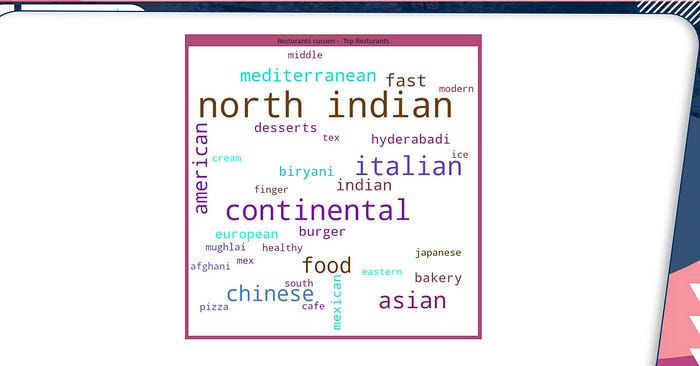
The following cuisine appears to be performing well among top-rated restaurants.
3. How Many Restaurants Accept Online Food Delivery?
top_locality = Delhi.Locality.value_counts().head(10) sns.set_theme(style="darkgrid") plt.figure(figsize=(12,6)) ax = sns.countplot(y= "Locality", hue="Has Online delivery", data=Delhi[Delhi.Locality.isin(top_locality.index)]) plt.title('Resturants Online Delivery');

Apart from Shahdara, restaurants in other parts of the city accept online orders.
In Defense colony and Malviya Nagar, online delivery appears to be on the rise.
4. Understanding Restaurants Ratings Locality
Besides Malviya Nagar and Defense colony, the rest of the neighborhoods seemed to prefer going to restaurants than buying food online.
Now let us know how these restaurants in Malviya Nagar, Defense colony, rate when it comes to online delivery.

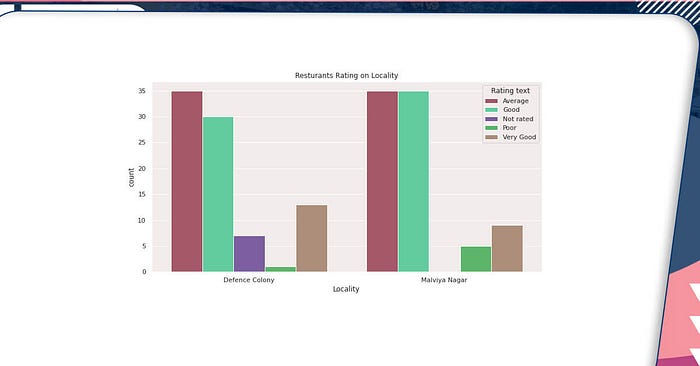
The number of highly rated restaurants appears to be high in Defense Colony, but Malviya Nagar appears to have done better as a result of Good and Average restaurants.
As eateries with a ‘Bad’ or ‘Not Rated’ rating are far fewer than those with a ‘Good’, ‘Very Good’, or ‘Excellent’ rating. As a result, residents in these areas prefer to order online.
5. Rating vs. Cost of Dining
plt.figure(figsize=(12,6)) sns.scatterplot(x="Average Cost for two", y="Aggregate rating", hue='Price range', data=Delhi) plt.xlabel("Average Cost for two") plt.ylabel("Aggregate rating") plt.title('Rating vs Cost of Two');

It is found that there is no relation between pricing and rating. For example, restaurant having good rating (like 4–5) have eateries encompasses the entire X axis with a wide range of prices.
6. Location of Highly Rated Restaurants Across New Delhi
Delhi['Rating text'].value_counts() Average 2495 Not rated 1425 Good 1128 Very Good 300 Poor 97 Excellent 28 Name: Rating text, dtype: int64 import plotly.express as px Highly_rated = Delhi[Delhi['Rating text'].isin(['Excellent'])] fig = px.scatter_mapbox(Highly_rated, lat="Latitude", lon="Longitude", hover_name="City", hover_data=["Aggregate rating", "Restaurant Name"], color_discrete_sequence=["fuchsia"], zoom=10, height=300) fig.update_layout(mapbox_style="open-street-map") fig.update_layout(margin={"r":0,"t":0,"l":0,"b":0}) fig.update_layout(title='Highle rated Resturants Location', autosize=True, hovermode='closest', showlegend=False) fig.update_layout( autosize=False, width=800, height=500,) fig.show()The four cities indicated above account for almost 65 percent of the total information in the dataset. Besides the highest rated local restaurants, it would be fascinating to learn about the well-known eateries in the area. These are the verticals over which they can be found:
7. Common Eateries
Breakfast and Coffee Locations
types = { "Breakfast and Coffee" : ["Cafe Coffee Day", "Starbucks", "Barista", "Costa Coffee", "Chaayos", "Dunkin' Donuts"], "American": ["Domino's Pizza", "McDonald's", "Burger King", "Subway", "Dunkin' Donuts", "Pizza Hut"], "Ice Creams and Shakes": ["Keventers", "Giani", "Giani's", "Starbucks", "Baskin Robbins", "Nirula's Ice Cream"] } breakfast = Delhi[Delhi['Restaurant Name'].isin(types['Breakfast and Coffee'])] american = Delhi[Delhi['Restaurant Name'].isin(types['American'])] ice_cream = Delhi[Delhi['Restaurant Name'].isin(types['Ice Creams and Shakes'])] breakfast = breakfast[['Restaurant Name','Aggregate rating']].groupby('Restaurant Name').mean().reset_index().sort_values('Aggregate rating',ascending=False) breakfast https://blog.jovian.ai/explanatory-data-analysis-of-zomato-restaurant-data-71ba8c3c7e5e import plotly.express as px df= breakfast fig = px.bar(df, y='Aggregate rating', x='Restaurant Name', text='Aggregate rating', title="Breakfast and Coffee locations") fig.update_traces(texttemplate='%{text:.3s}', textposition='outside') fig.update_layout( autosize=False, width=800, height=500,) fig.show()

The Chaayos stores are doing much better. More of those are needed in Delhi. Café Coffee Day appears to have a low average rating. They must increase the quality of their offerings.
Fast Food Restaurants


american = american[['Restaurant Name','Aggregate rating']].groupby('Restaurant Name').mean().reset_index().sort_values('Aggregate rating',ascending=False) americanimport plotly.express as px df= american fig = px.bar(df, y='Aggregate rating', x='Restaurant Name', text='Aggregate rating', title="Fast Food Resturants") fig.update_traces(texttemplate='%{text:.3s}', textposition='outside') fig.update_layout( autosize=False, width=800, height=500,) fig.show()
Ice Cream Parlors
ice_cream = ice_cream[['Restaurant Name','Aggregate rating']].groupby('Restaurant Name').mean().reset_index().sort_values('Aggregate rating',ascending=False) ice_creamimport plotly.express as px df= ice_cream fig = px.bar(df, y='Aggregate rating', x='Restaurant Name', text='Aggregate rating', title="Ice Cream Parlours") fig.update_traces(texttemplate='%{text:.3s}', textposition='outside') fig.update_layout( autosize=False, width=800, height=500,) fig.show()

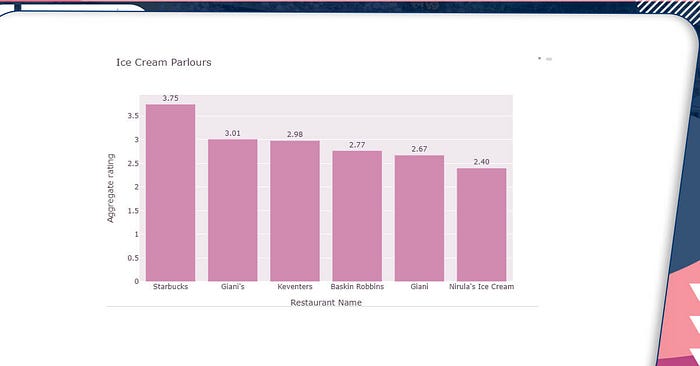
Local brands appear to be doing better than foreign brands.
Conclusion
Here’s a quick rundown of a few:
The dataset is skewed toward India and does not include all restaurant data from around the world.
Restaurants are rated in six different categories.
Although Connaught Palace has the most restaurants listed on Zomato, it does not offer online deliveries. The situation in Defense Colony and Malviya Nagar appears to be improving.
The following cuisine appears to be receiving good ratings at the top-rated restaurants.
Italian-American Chinese-North Indian
There is no link between the price and the rating. Some of the highest-rated restaurants are also the least expensive, and vice versa.
In terms of common eateries, Indian restaurants appear to be better rated for breakfast and coffee, whereas American restaurants appear to be better rated for fast food chains and ice cream parlors.
If you want to know more about our other restaurant data scraping services or Zomato restaurant data scraping service then contact Foodspark now!!


.png)
Comments
Post a Comment